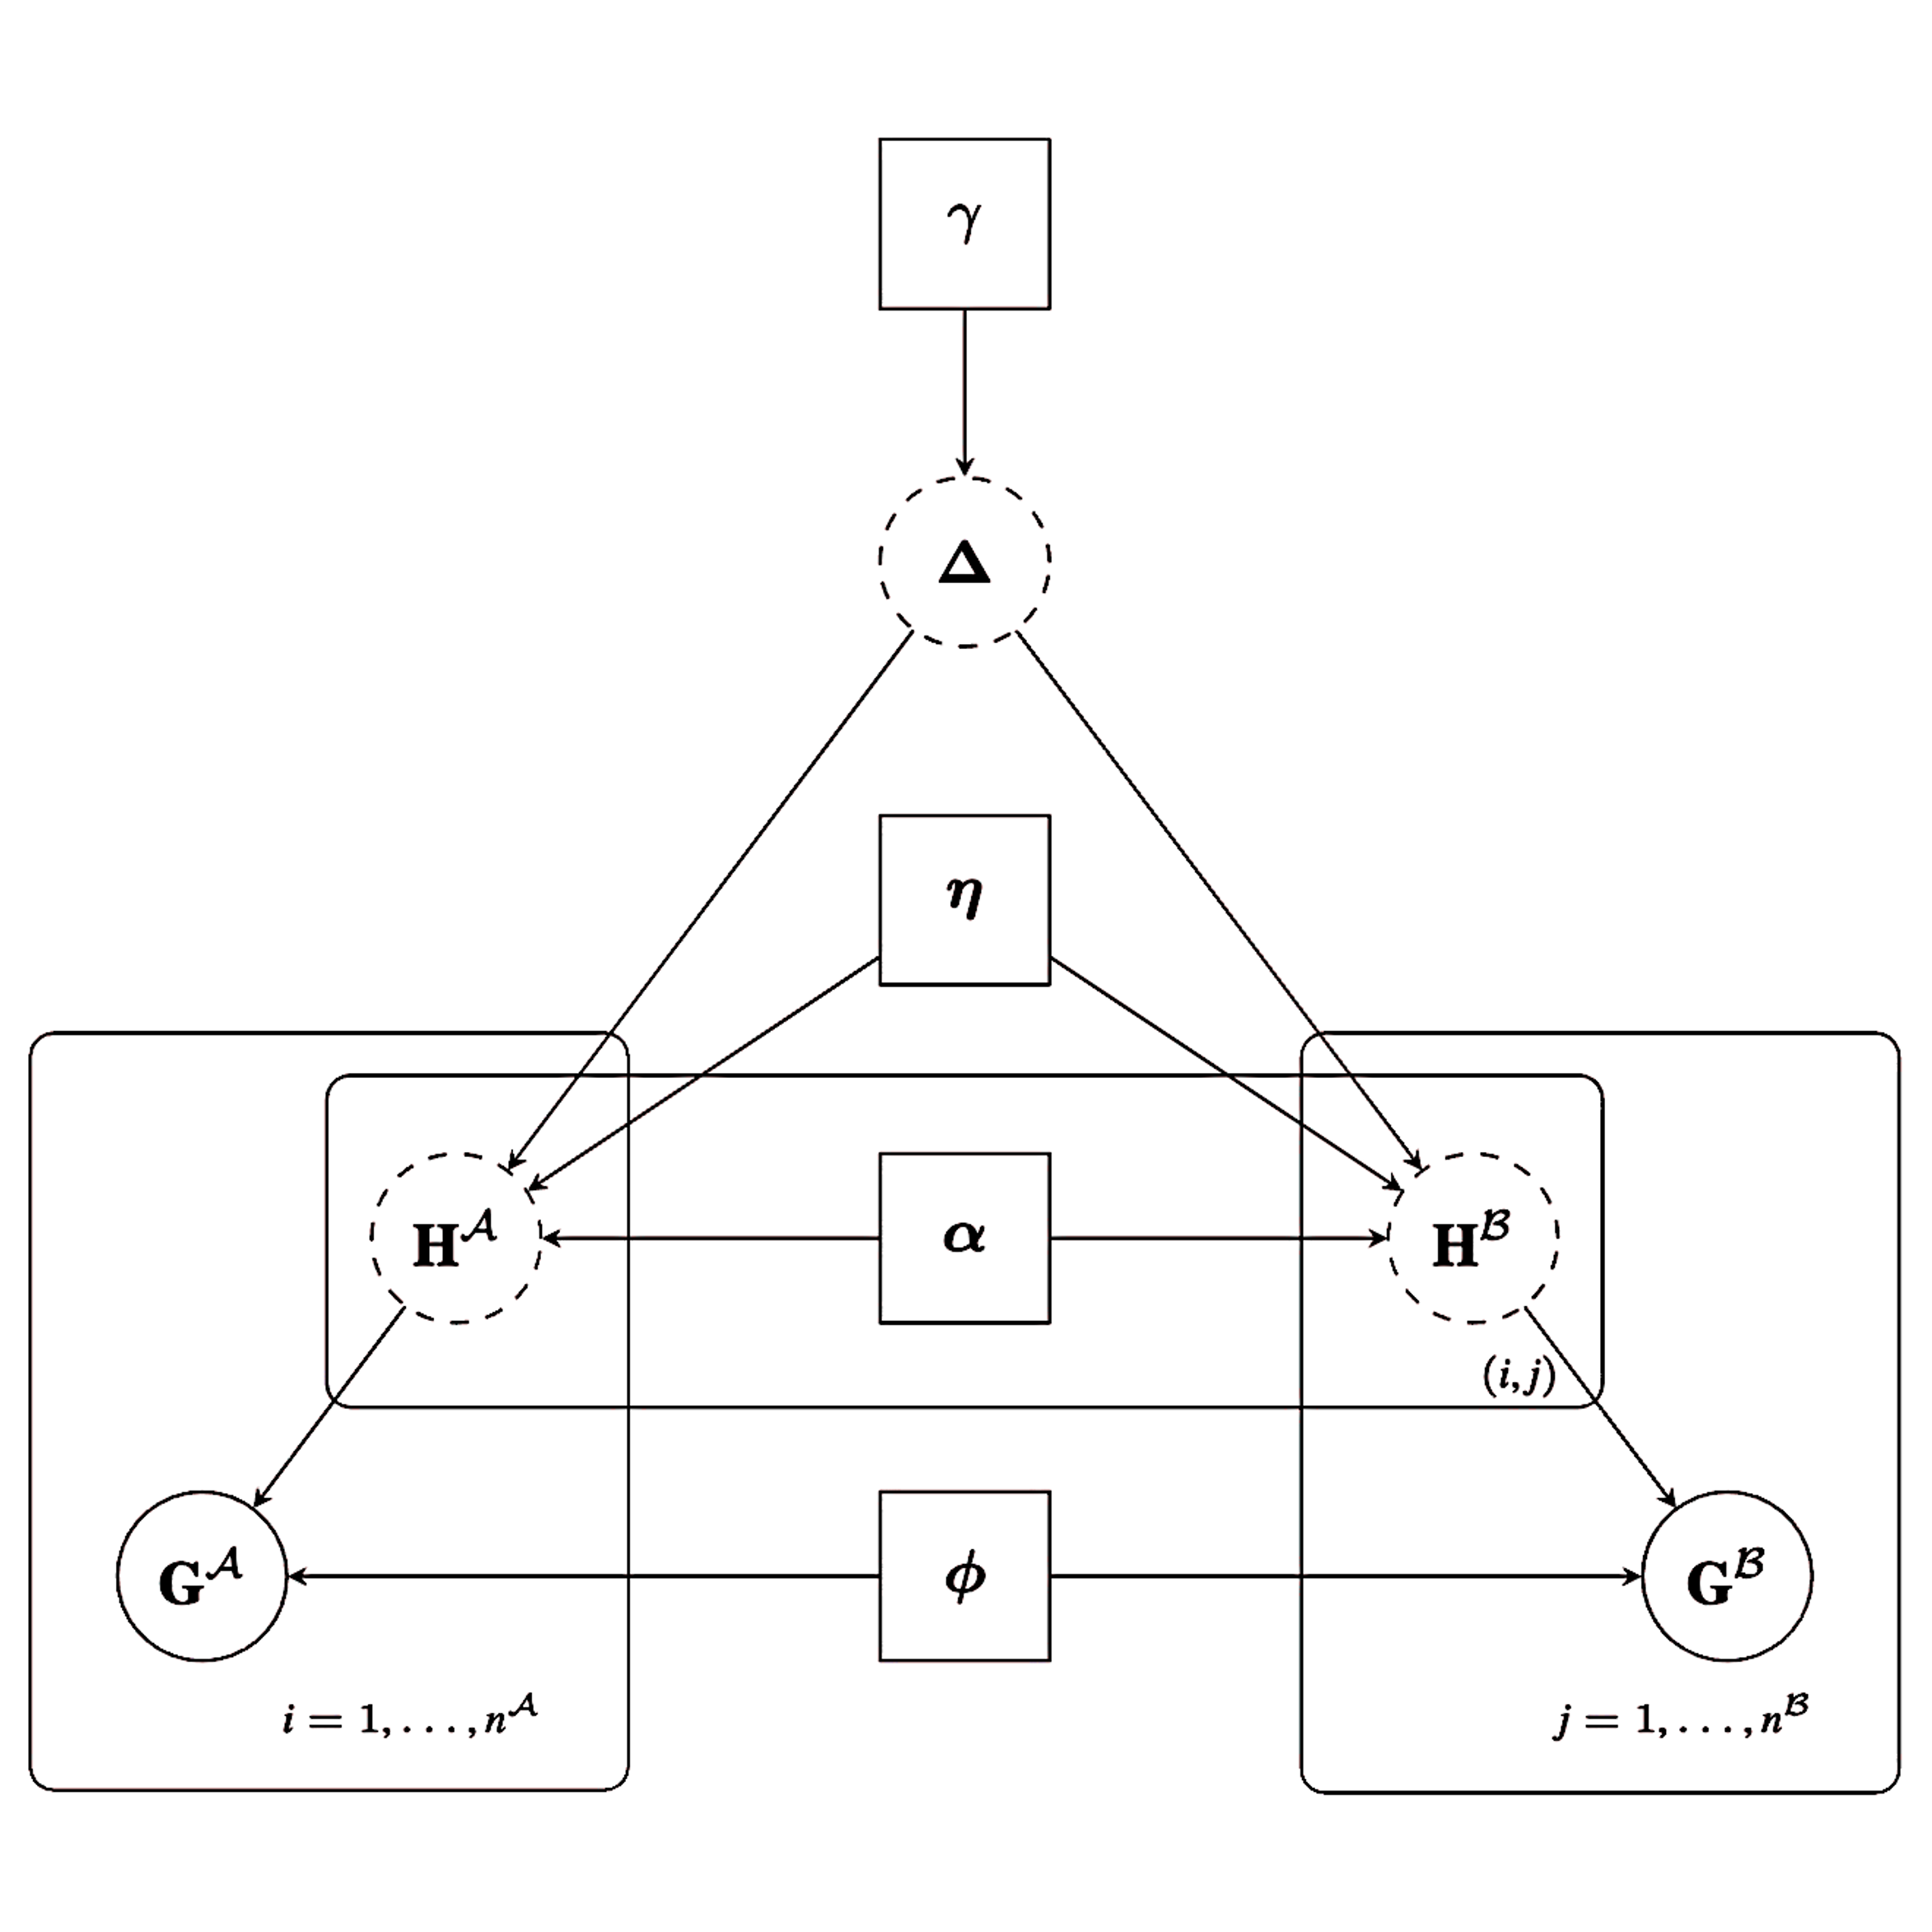
Plot the distribution of linkage scores
Examples
fit_Delta_x <- c(0,0,0,0,0,0,0,0,0,0.1,0.1,0.1,0.1,0.1,0.1,0.1,0.1,0.1,0.1,
0.2,0.2,0.2,0.2,0.4,0.4,0.4,0.4,0.4,0.5,0.6,0.7,0.7,0.7,0.7,0.7,0.7,0.8,0.8)
plot_linkage_scores(1000, fit_Delta_x)
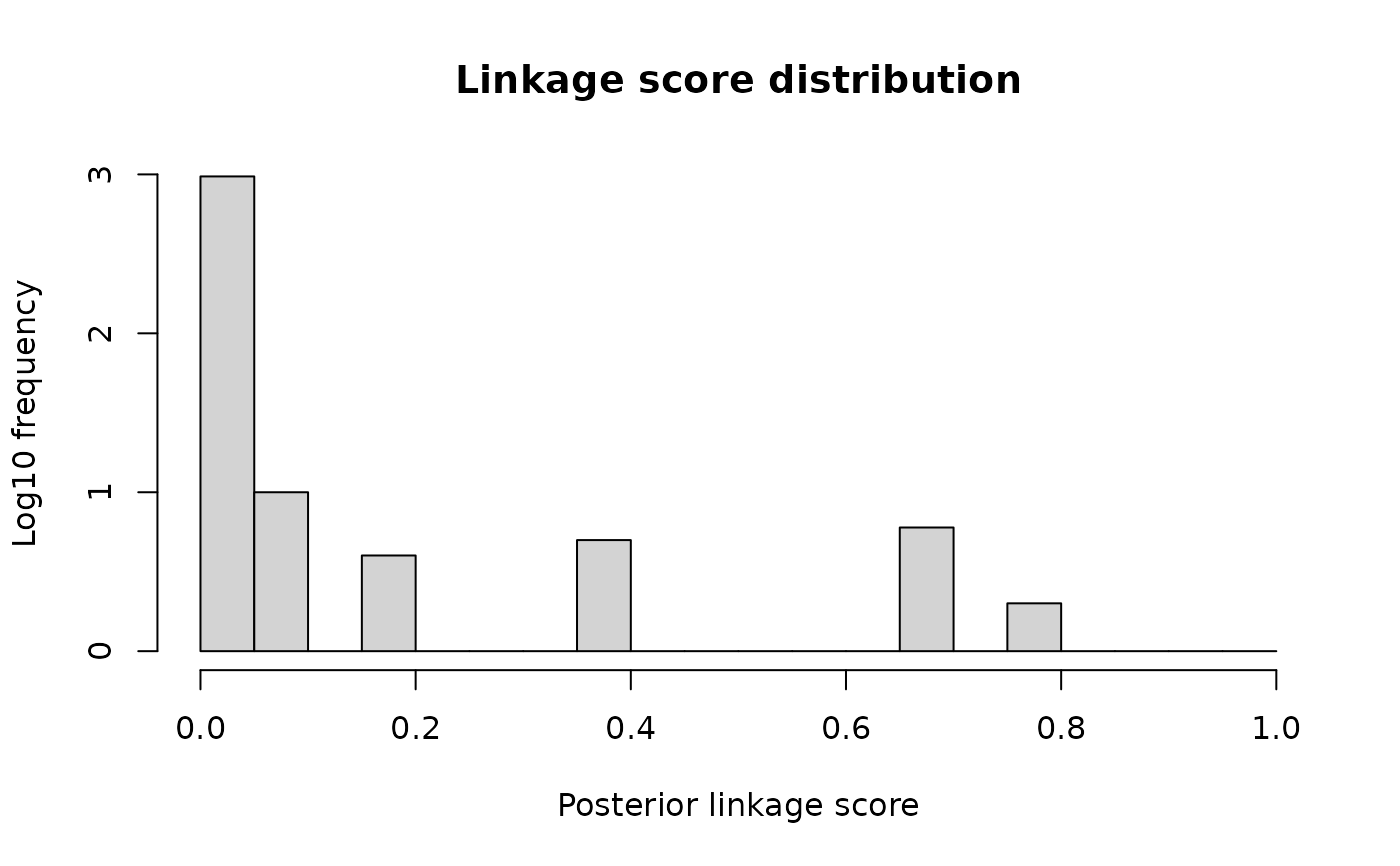
Plot the distribution of linkage scores
fit_Delta_x <- c(0,0,0,0,0,0,0,0,0,0.1,0.1,0.1,0.1,0.1,0.1,0.1,0.1,0.1,0.1,
0.2,0.2,0.2,0.2,0.4,0.4,0.4,0.4,0.4,0.5,0.6,0.7,0.7,0.7,0.7,0.7,0.7,0.8,0.8)
plot_linkage_scores(1000, fit_Delta_x)